Open interest by category
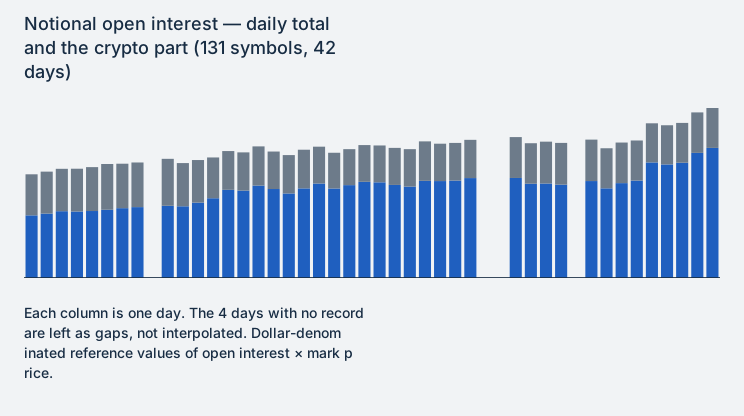
- Across the 131 symbols with a record on every one of the 42 days, the notional open-interest total ran from $9.98B to $16.37B.
- Crypto's share of the notional total moved from 60.4% on the first day to 76.5% on the last. From the first day to the last, notional value fell 16.7% for commodities and added 1.1% for U.S. stocks.
- The figures are Hyperliquid perpetual-futures reference values. Four missing days are shown as gaps, not interpolated.
Section highlights (3)
Contents
Vertical scale: 0 at the bottom, $16.37B at the top (the total on 22 September)
- Crypto
- The other six categories
- 8 August: total $9.98B (crypto $6.03B, the other six categories $3.95B)
- 22 September: total $16.37B (crypto $12.53B, the other six categories $3.84B)
Each column is one day. The 4 days with no record are left as gaps, not interpolated. Dollar-denominated reference values of open interest × mark price.
Open interest is the total number of positions that have not been closed.
The public Hyperliquid API keeps no history of open interest. This site saves one snapshot a day and accumulates its own record.
This article aggregates 42 days of that record by the same categories the site itself uses.
How it was measured — open interest times price, summed by category
The record and the unit
The source data is this site's own daily snapshots. The period covered is 8 August to 22 September 2026, and the record contains 42 days.
Four days have no record: 16 August, 7 September, 8 September and 13 September. They are left as gaps; nothing is interpolated.
Each day is recorded once. On 41 of the days the capture falls between 22:04:45 and 22:05:05 UTC; the last day, 22 September, was captured at 23:26:40 UTC.
The notional figure is each symbol's open interest multiplied by its mark price, summed in dollars as a reference value. Open-interest quantities are counted in contract units: one unit is the amount that the displayed price is quoted for (for BTC, one BTC).
The symbols and the categories
The site listed 155 symbols as of 22 September. The categories are the site's own seven sections, used unchanged.
Open the table: Symbols by category (8 rows)
| Category | Symbols listed (as of 22 Sep) | Of which recorded on all 42 days |
|---|---|---|
| Crypto | 19 | 19 |
| U.S. Stocks | 84 | 67 |
| Indices | 20 | 17 |
| Commodities | 8 | 8 |
| Japan & Asia | 14 | 12 |
| New Listings | 7 | 5 |
| FX | 3 | 3 |
| Total | 155 | 131 |
Listed symbols were added during the period. The record on 8 August contains 131 symbols; from 17 September onward it contains all 155.
To compare the first day with the last on equal terms, every total, change rate and share in this article is computed on the 131 symbols present in all 42 days of records.
The universe is 131 symbols. The 155 figure is the listing count and is not used in the totals.
The result — from $9.98B to $16.37B
The notional total on the matched 131 symbols ran from $9.98B on 8 August to $16.37B on 22 September, a change of +63.9%.
Open the table: Notional value and share by category (8 rows)
| Category | 8 Aug ($B) | 22 Sep ($B) | Change | Share of total |
|---|---|---|---|---|
| Crypto | 6.03 | 12.53 | +107.6% | 60.4% → 76.5% |
| U.S. Stocks | 1.49 | 1.51 | +1.1% | 14.9% → 9.2% |
| Indices | 0.74 | 0.76 | +2.4% | 7.4% → 4.6% |
| Commodities | 0.93 | 0.78 | -16.7% | 9.3% → 4.7% |
| Japan & Asia | 0.53 | 0.45 | -13.8% | 5.3% → 2.8% |
| New Listings | 0.23 | 0.29 | +28.2% | 2.3% → 1.8% |
| FX | 0.03 | 0.05 | +69.4% | 0.3% → 0.3% |
| Total | 9.98 | 16.37 | +63.9% | 100% → 100% |
The six categories other than crypto, taken together, ran from $3.95B to $3.84B, a change of -2.7%. The breakdown of the change is +$6.49B for crypto against -$0.11B for the other six combined.
Each change amount is computed from the unrounded values. Subtracting the displayed values gives +$6.39B for the total and +$6.50B for crypto. The $0.01B gap is a rounding difference.
The total gained 63.9%. Crypto came to hold 76.5% of the notional figure.
Category by category
Crypto — from $6.03B to $12.53B
The change was +107.6%. The minimum of the 42 days was the first day (8 August) and the maximum was the last (22 September).
On 22 September, BTC, ETH and HYPE together held $9.31B, or 74.3% of the crypto figure.
The notional figure also carries the price move inside it. Two symbols show the position count and the price separately.
Open the table: BTC and HYPE: open interest, price and notional (2 rows)
| Symbol | Open interest | Mark price | Notional |
|---|---|---|---|
| BTC | 34,600.11 → 46,396.33 BTC (+34.1%) | $64,992 → $86,249 (+32.7%) | $2.25B → $4.00B |
| HYPE | 21,866,360 → 21,878,488 (+0.1%) | $55.06 → $97.15 (+76.4%) | $1.20B → $2.13B |
For BTC, both the position count and the price grew. For HYPE, the position count was nearly unchanged, so the notional increase is the price component alone.
Crypto more than doubled. The growth mixes larger positions with higher prices.
U.S. Stocks — almost flat
From $1.49B to $1.51B, a change of +1.1%. The period maximum was $1.72B on 17 August and the minimum was $1.27B on 22 August.
Indices — +2.4%
From $0.74B to $0.76B. The maximum was $0.96B on 13 August and the minimum was $0.64B on 4 September.
Commodities — -16.7%
From $0.93B to $0.78B. The maximum was $1.00B on 11 September and the minimum was $0.69B on 28 August.
Gold's open interest fell 10.6%, from 76,287.45 to 68,191.03. Its price moved +0.4%, from $4,348.4 to $4,364.9, so the notional figure went from $0.33B to $0.30B (-10.3%).
Japan & Asia — -13.8%
From $0.53B to $0.45B. The maximum was $0.66B on 17 August and the minimum was $0.40B on 1 September.
New Listings — +28.2%
From $0.23B to $0.29B. The maximum was $0.38B on 17 August and the minimum was $0.20B on 24 August.
FX — the smallest category
From $31.2M to $52.9M, a change of +69.4%. Its share of the total stayed at 0.3%.
Every day of the record (131 symbols, $M)
Each row is a recorded date. The four missing days (16 August, 7 September, 8 September, 13 September) have no row. Each cell is rounded, so the seven categories and the total column can differ by up to $0.2M.
Open the table: Every day of the record ($M) (42 rows)
| Date | Crypto | U.S. Stocks | Indices | Commodities | Japan & Asia | New Listings | FX | Total |
|---|---|---|---|---|---|---|---|---|
| 2026-08-08 | 6,033.3 | 1,492.3 | 741.5 | 932.4 | 525.4 | 227.8 | 31.2 | 9,984.0 |
| 2026-08-09 | 6,202.9 | 1,514.5 | 787.0 | 943.0 | 532.6 | 229.9 | 31.4 | 10,241.3 |
| 2026-08-10 | 6,432.2 | 1,497.1 | 784.5 | 994.3 | 547.1 | 225.7 | 31.9 | 10,512.6 |
| 2026-08-11 | 6,400.8 | 1,526.8 | 781.0 | 990.4 | 548.1 | 241.8 | 31.9 | 10,520.8 |
| 2026-08-12 | 6,448.7 | 1,545.4 | 860.0 | 960.1 | 564.8 | 264.6 | 31.7 | 10,675.2 |
| 2026-08-13 | 6,570.0 | 1,534.4 | 963.4 | 894.9 | 627.5 | 354.3 | 30.9 | 10,975.4 |
| 2026-08-14 | 6,724.4 | 1,565.1 | 846.8 | 872.1 | 603.3 | 362.3 | 30.4 | 11,004.4 |
| 2026-08-15 | 6,824.6 | 1,561.2 | 859.8 | 869.0 | 609.9 | 366.9 | 30.2 | 11,121.6 |
| 2026-08-17 | 6,952.8 | 1,723.4 | 854.8 | 867.1 | 661.4 | 382.4 | 32.1 | 11,473.9 |
| 2026-08-18 | 6,905.7 | 1,507.8 | 844.0 | 855.8 | 598.9 | 320.8 | 32.0 | 11,065.0 |
| 2026-08-19 | 7,257.0 | 1,457.8 | 820.1 | 871.6 | 628.8 | 291.3 | 30.7 | 11,357.2 |
| 2026-08-20 | 7,679.4 | 1,431.1 | 778.9 | 898.7 | 548.3 | 240.1 | 29.8 | 11,606.2 |
| 2026-08-21 | 8,490.3 | 1,315.6 | 734.2 | 920.8 | 515.9 | 215.5 | 29.3 | 12,221.7 |
| 2026-08-22 | 8,416.2 | 1,266.3 | 738.6 | 919.7 | 513.3 | 210.2 | 30.5 | 12,094.8 |
| 2026-08-23 | 8,898.3 | 1,297.5 | 776.7 | 916.7 | 528.1 | 216.2 | 36.6 | 12,670.2 |
| 2026-08-24 | 8,566.7 | 1,273.1 | 769.5 | 905.1 | 429.6 | 197.9 | 34.5 | 12,176.4 |
| 2026-08-25 | 8,140.0 | 1,307.4 | 763.1 | 888.9 | 501.4 | 203.1 | 31.0 | 11,834.8 |
| 2026-08-26 | 8,629.6 | 1,334.4 | 780.0 | 857.4 | 515.2 | 203.1 | 31.0 | 12,350.7 |
| 2026-08-27 | 9,092.8 | 1,365.5 | 682.6 | 788.2 | 480.4 | 200.8 | 32.3 | 12,642.7 |
| 2026-08-28 | 8,617.1 | 1,399.1 | 675.2 | 694.8 | 425.5 | 213.7 | 31.7 | 12,057.1 |
| 2026-08-29 | 8,941.0 | 1,398.8 | 685.1 | 700.7 | 433.6 | 213.3 | 31.6 | 12,404.0 |
| 2026-08-30 | 9,260.9 | 1,408.8 | 701.4 | 750.7 | 431.9 | 212.9 | 31.7 | 12,798.2 |
| 2026-08-31 | 9,213.0 | 1,384.1 | 733.7 | 758.5 | 421.3 | 217.0 | 32.4 | 12,760.0 |
| 2026-09-01 | 8,961.3 | 1,341.0 | 740.4 | 851.4 | 395.5 | 207.9 | 30.4 | 12,527.9 |
| 2026-09-02 | 8,800.5 | 1,378.2 | 730.3 | 844.7 | 405.9 | 215.4 | 29.3 | 12,404.3 |
| 2026-09-03 | 9,354.0 | 1,483.3 | 680.8 | 932.4 | 435.3 | 235.8 | 32.5 | 13,154.1 |
| 2026-09-04 | 9,331.8 | 1,394.6 | 636.0 | 882.3 | 401.5 | 251.7 | 31.7 | 12,929.6 |
| 2026-09-05 | 9,379.5 | 1,401.5 | 643.9 | 892.1 | 404.4 | 251.2 | 31.6 | 13,004.2 |
| 2026-09-06 | 9,620.2 | 1,417.7 | 652.4 | 915.7 | 411.4 | 252.6 | 31.5 | 13,301.4 |
| 2026-09-09 | 9,630.3 | 1,435.5 | 700.0 | 948.6 | 486.4 | 292.7 | 72.6 | 13,566.3 |
| 2026-09-10 | 9,075.3 | 1,371.2 | 672.1 | 960.4 | 487.4 | 338.2 | 70.1 | 12,974.8 |
| 2026-09-11 | 9,096.1 | 1,407.5 | 743.0 | 1,003.4 | 494.8 | 337.3 | 43.5 | 13,125.7 |
| 2026-09-12 | 8,986.9 | 1,415.2 | 754.2 | 995.2 | 475.9 | 336.8 | 43.1 | 13,007.3 |
| 2026-09-14 | 9,333.8 | 1,421.9 | 761.4 | 933.4 | 489.6 | 340.7 | 41.1 | 13,321.9 |
| 2026-09-15 | 8,633.9 | 1,375.8 | 788.5 | 856.5 | 460.9 | 334.6 | 41.8 | 12,492.0 |
| 2026-09-16 | 9,133.9 | 1,476.5 | 754.0 | 874.3 | 445.9 | 314.9 | 41.0 | 13,040.4 |
| 2026-09-17 | 9,378.0 | 1,423.9 | 794.9 | 823.3 | 457.5 | 320.6 | 40.4 | 13,238.8 |
| 2026-09-18 | 11,128.0 | 1,433.6 | 721.1 | 813.3 | 444.6 | 312.3 | 40.6 | 14,893.5 |
| 2026-09-19 | 10,932.8 | 1,435.5 | 730.2 | 808.5 | 442.8 | 311.2 | 44.3 | 14,705.4 |
| 2026-09-20 | 11,099.2 | 1,446.3 | 739.0 | 837.0 | 446.8 | 312.0 | 52.8 | 14,933.2 |
| 2026-09-21 | 12,046.5 | 1,514.0 | 772.8 | 811.2 | 462.9 | 284.5 | 52.1 | 15,944.0 |
| 2026-09-22 | 12,525.2 | 1,508.3 | 759.1 | 777.0 | 452.7 | 292.1 | 52.9 | 16,367.2 |
Common questions
Q. Is this the open interest of the cash market?
A. No. It is the open interest of Hyperliquid perpetual futures. The notional figure is a dollar-denominated reference value using the mark price, not the open interest or volume of a cash market.
Q. Why does the number of symbols differ by day?
A. Some symbols began trading during the period. Changes and shares are computed on the 131 symbols present on every one of the 42 days.
Q. Does rising open interest mean rising prices?
A. This article does not make that link. Open interest is the total of open positions; it does not show a price direction. The notional figure also contains the price move itself.
Q. Why is the change of the total $6.38B when $16.37B minus $9.98B is $6.39B?
A. The change is computed before rounding. In the daily table the totals are $16,367.2M and $9,984.0M, and their difference is $6,383.2M, shown as $6.38B. Subtracting the two rounded figures gives $6.39B.
Q. Will it keep growing?
A. That is not written here. This article is a record of 42 days, not a forecast of future moves.
Summary
- The notional open interest of the 131 matched symbols ran from $9.98B to $16.37B, a change of +63.9%.
- Crypto's share moved from 60.4% on the first day to 76.5% on the last. Its +$6.49B gain exceeds the +$6.38B change of the total.
- Commodities fell 16.7%, Japan & Asia fell 13.8%, U.S. Stocks added 1.1%, and FX stayed the smallest at $0.05B.
- The four missing days are not interpolated. All figures are perpetual-futures reference values.
Current open interest can be seen on the market-cap tab. For the weekend measurement, see how much world share prices move at the weekend; for the overnight measurement, see how much the Nikkei 225 moves overnight.
This article explains a record. It does not recommend any particular trade.
Source: Hyperliquid public API / Published: / Last updated: / Perpetual-futures prices are reference values.